Data and Visualizations
Databases and Datasets
Neotoma Paleoecology Database
Neotoma is a community-curated data repository for paleoecological data for the Plio-Pleistocene. Neotoma is widely used to study the spatial responses of species and communities to past environmental change. Additionally,the neotoma2 R package provides access to and manipulation of Neotoma data directly from R, the package simplifies some of the data structures and concepts to facilitate statistical analysis and visualization.
Earth Life Consortium
The Earth Life Consortium offers a common portal to jointly query from Neotoma, the PBDB, and other paleobiological resources.
Downscaled and debiased climate simulations for North America from 21,000 years ago to 2100AD
Archived on Dryad. Downscaled and debiased paleoclimatic simulations from 21,000 years ago to 2100AD. Downscaled to 0.5deg lat/lon and decadal resolution for North America. Paleoclimatic simulations from CCSM3 (Liu et al. 2009) and EC-BILT (Timm & Timmermann, 2007). 21st-century climate simulations from the CMIP5/IPCC AR5 model archive, for the RCP 4.5 and 8.5 scenarios.
North American Modern Pollen Dataset
The NAPMD archives pollen surface samples from North America, along with attributed climatic and vegetational data for each location. A full description of the dataset and its compilation is provided by Whitmore et al. (2005). This data is the foundation for an atlas of modern pollen-climate and pollen-vegetation relationships (Williams et al., 2006). Additionally, PDFs of maps and climate-vegetation-pollen plots are available at NOAA.
Global Pollen Project
The GPP, developed by Andrew Martin and Will Harvey (Martin and Harvey, 2017), offers a community portal for digital pollen images and identification.
Visualizations
Range Mapper
Range Mapper is an interactive map interface that shows the distribution of major tree taxa and the extent of ice sheets from the Last Glacial Maximum to present.
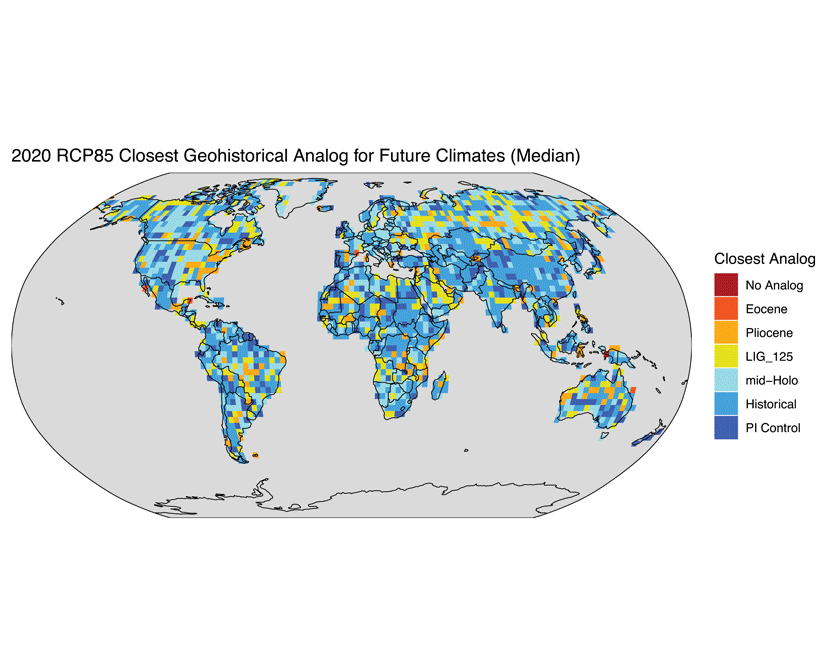
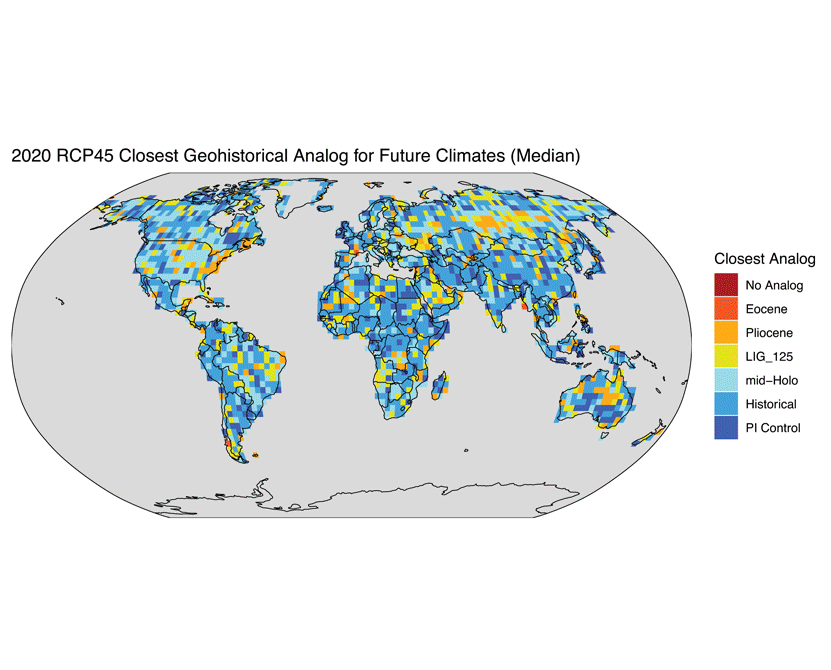
Future Climate Analog Animations
Under a high-end emissions scenario (RCP8.5), future climates resemble Pliocene-like climates by 2030 CE, and resemble Eocene-like climates by 2150 CE. Under a more moderate, stabilization emissions scenario (RCP4.5), future climates resemble Pliocene-like climates by 2040 CE and remain most similar to those of the Pliocene through 2300.
Settlement-Era Maps of Tree Composition
These maps of tree distributions at the time of Euro-American settlement were compiled from Public Land Survey (PLS) and Township Proprietor Survey (TPS) data by the Settlement Vegetation Group of the PalEON project. The compilation and cleaning of the settlement-era datasets are described in Goring et al. 2016 PLoS and the spatiotemporal statistical modeling is described in Paciorek et al. 2016 PLoS. Support for the PalEON project provided by NSF-Macrosystems.
Climate Analog Mapper (WICCI)
The climate analog mapper allows you to ask a simple question: What climates today most resemble the future climates projected for my location? An interactive map interface enables users to find contemporary analogs for the future climates projected for Wisconsin locations. Developed as part of the Wisconsin Initiative on Climate Change Impacts WICCI.
Pollen Viewer
Pollen Viewer, originally developed by Phil Leduc, Jack Williams, Bryan Shuman, Patrick Bartlein, and Tom Webb, shows animated maps of plant distributions for the last 21,000 years. Unfortunately, Pollen Viewer is now defunct, but you can download the animated gifs and individual images from NOAA or here.
Presentations on FigShare
Public presentations about climate change, ecological responses to climate change, and other topics are posted to figShare.
Code & Software
GitHub
We use GitHub to share code for individual and group research projects. Williams Lab holds code for group projects. See the People page for GitHub links for individual accounts.
Tilia
Tilia is software developed by Eric Grimm upload, download, and view data from Neotoma. It is a primary tool for Neotoma Data Stewards.
Flyover Country
Flyover Country iOS and Android App for viewing geological data while flying, driving, and traveling. Includes Neotoma data!## Older Resources
These materials are less up-to-date but are maintained for purposes of archival and reproducibility.
Databases and Datasets
Modern Plant-Climate Research Dataset for Eastern North American Plant Taxa
This research dataset was created by Gonzales et al. (2009a,b) from the North American Modern Pollen Database (version 1.6.1) (Whitmore et al., 2005) with the purpose of modeling plant-climate relationships for taxa in eastern North America. The dataset contains 2,613 sites in eastern North America and Canada. Although the primary purpose for creating this dataset was to model late-glacial pollen-climate relationships in eastern North America, other potential uses of this dataset include vegetation reconstruction at local to subcontinental scales and forward modeling of pollen and vegetation from climate variables. For regional- to subcontinental-scale climate and vegetation reconstructions for eastern North America, the research dataset can be used without further modification.
Climate-Dissimilarity Dataset
These files contain the climate-dissimilarity results reported in Williams et al. (2007, PNAS). The following runs are stored here: 1) “novel” climates: Dissimilarities between each 21st-century target gridcell and its closest 20th-century analogue. These results are shown in Panels 2C and 2D of Williams et al. 2007. 2) “local” climate change: Dissimilarities calculated between the late 20th-century and late 21st-century climate for each gridcell. These results are shown in Panels 2A and 2B of Williams et al. 2007. 3) “disappearing” climates: Dissimilarities between each 20th-century target gridcell and its closest 21st-century analogue. These results are shown in Panels 2E and 2F of Williams et al. 2007. 4) same as “novel” climates, except that a 500-km constraint was placed on the search for analogues. High SED values indicate novel climates within this search radius. These results are shown in Panels 3A and 3B of Williams et al. 2007. 5) same as “disappearing” climates, except that a 500-km constraint was placed on the search for analogues. High SED values indicate disappearing climates within this search radius. These results are shown in Panels 3C and 3D of Williams et al. 2007.
Woody Cover Reconstructions
This dataset archives woody cover reconstructions for Midwestern US pollen records, based on the modern analog technique applied to AVHRR data. Data and methods described in Williams et al. (2009), Global and Planetary Change.